
Statistical Methods & Thinking
This podcast presents materials for the course Applied Statistical Methods at NYCU, taught by Weijing Wang. It explains core techniques for analyzing associations in data, including correlation analysis and simple and multiple linear regression. It covers estimation, hypothesis testing, and model checking in regression. It also discusses association versus causation. Additional topics include contingency tables, chi-square tests, logistic regression, and the generalized linear model framework.
单集

Episode 13 | Survival Analysis: Making Sense of Time-to-Event Data
In this episode, we introduce the core ideas behind analyzing time-to-event data—situations where the outcome isn’t just “what happened,” but when it happened. A key challenge is that some participants haven’t experienced the event yet by the end of follow-up (or they drop out), so the data are only partially observed.We build the intuition for describing how risk changes over time, then walk thro

Episode 12 | Clustering and Classification: Finding Structure in Data
In this episode, we step into multivariate thinking and ask a practical question: when do data points naturally form “groups,” and how can we use those groups to make decisions?We walk through how grouping methods decide what’s “close” or “similar,” then compare two main approaches—building clusters step by step versus forming clusters all at once. You’ll also hear how tree-like visual summaries h
Episode 11 | Finding Structure in Multivariate Data
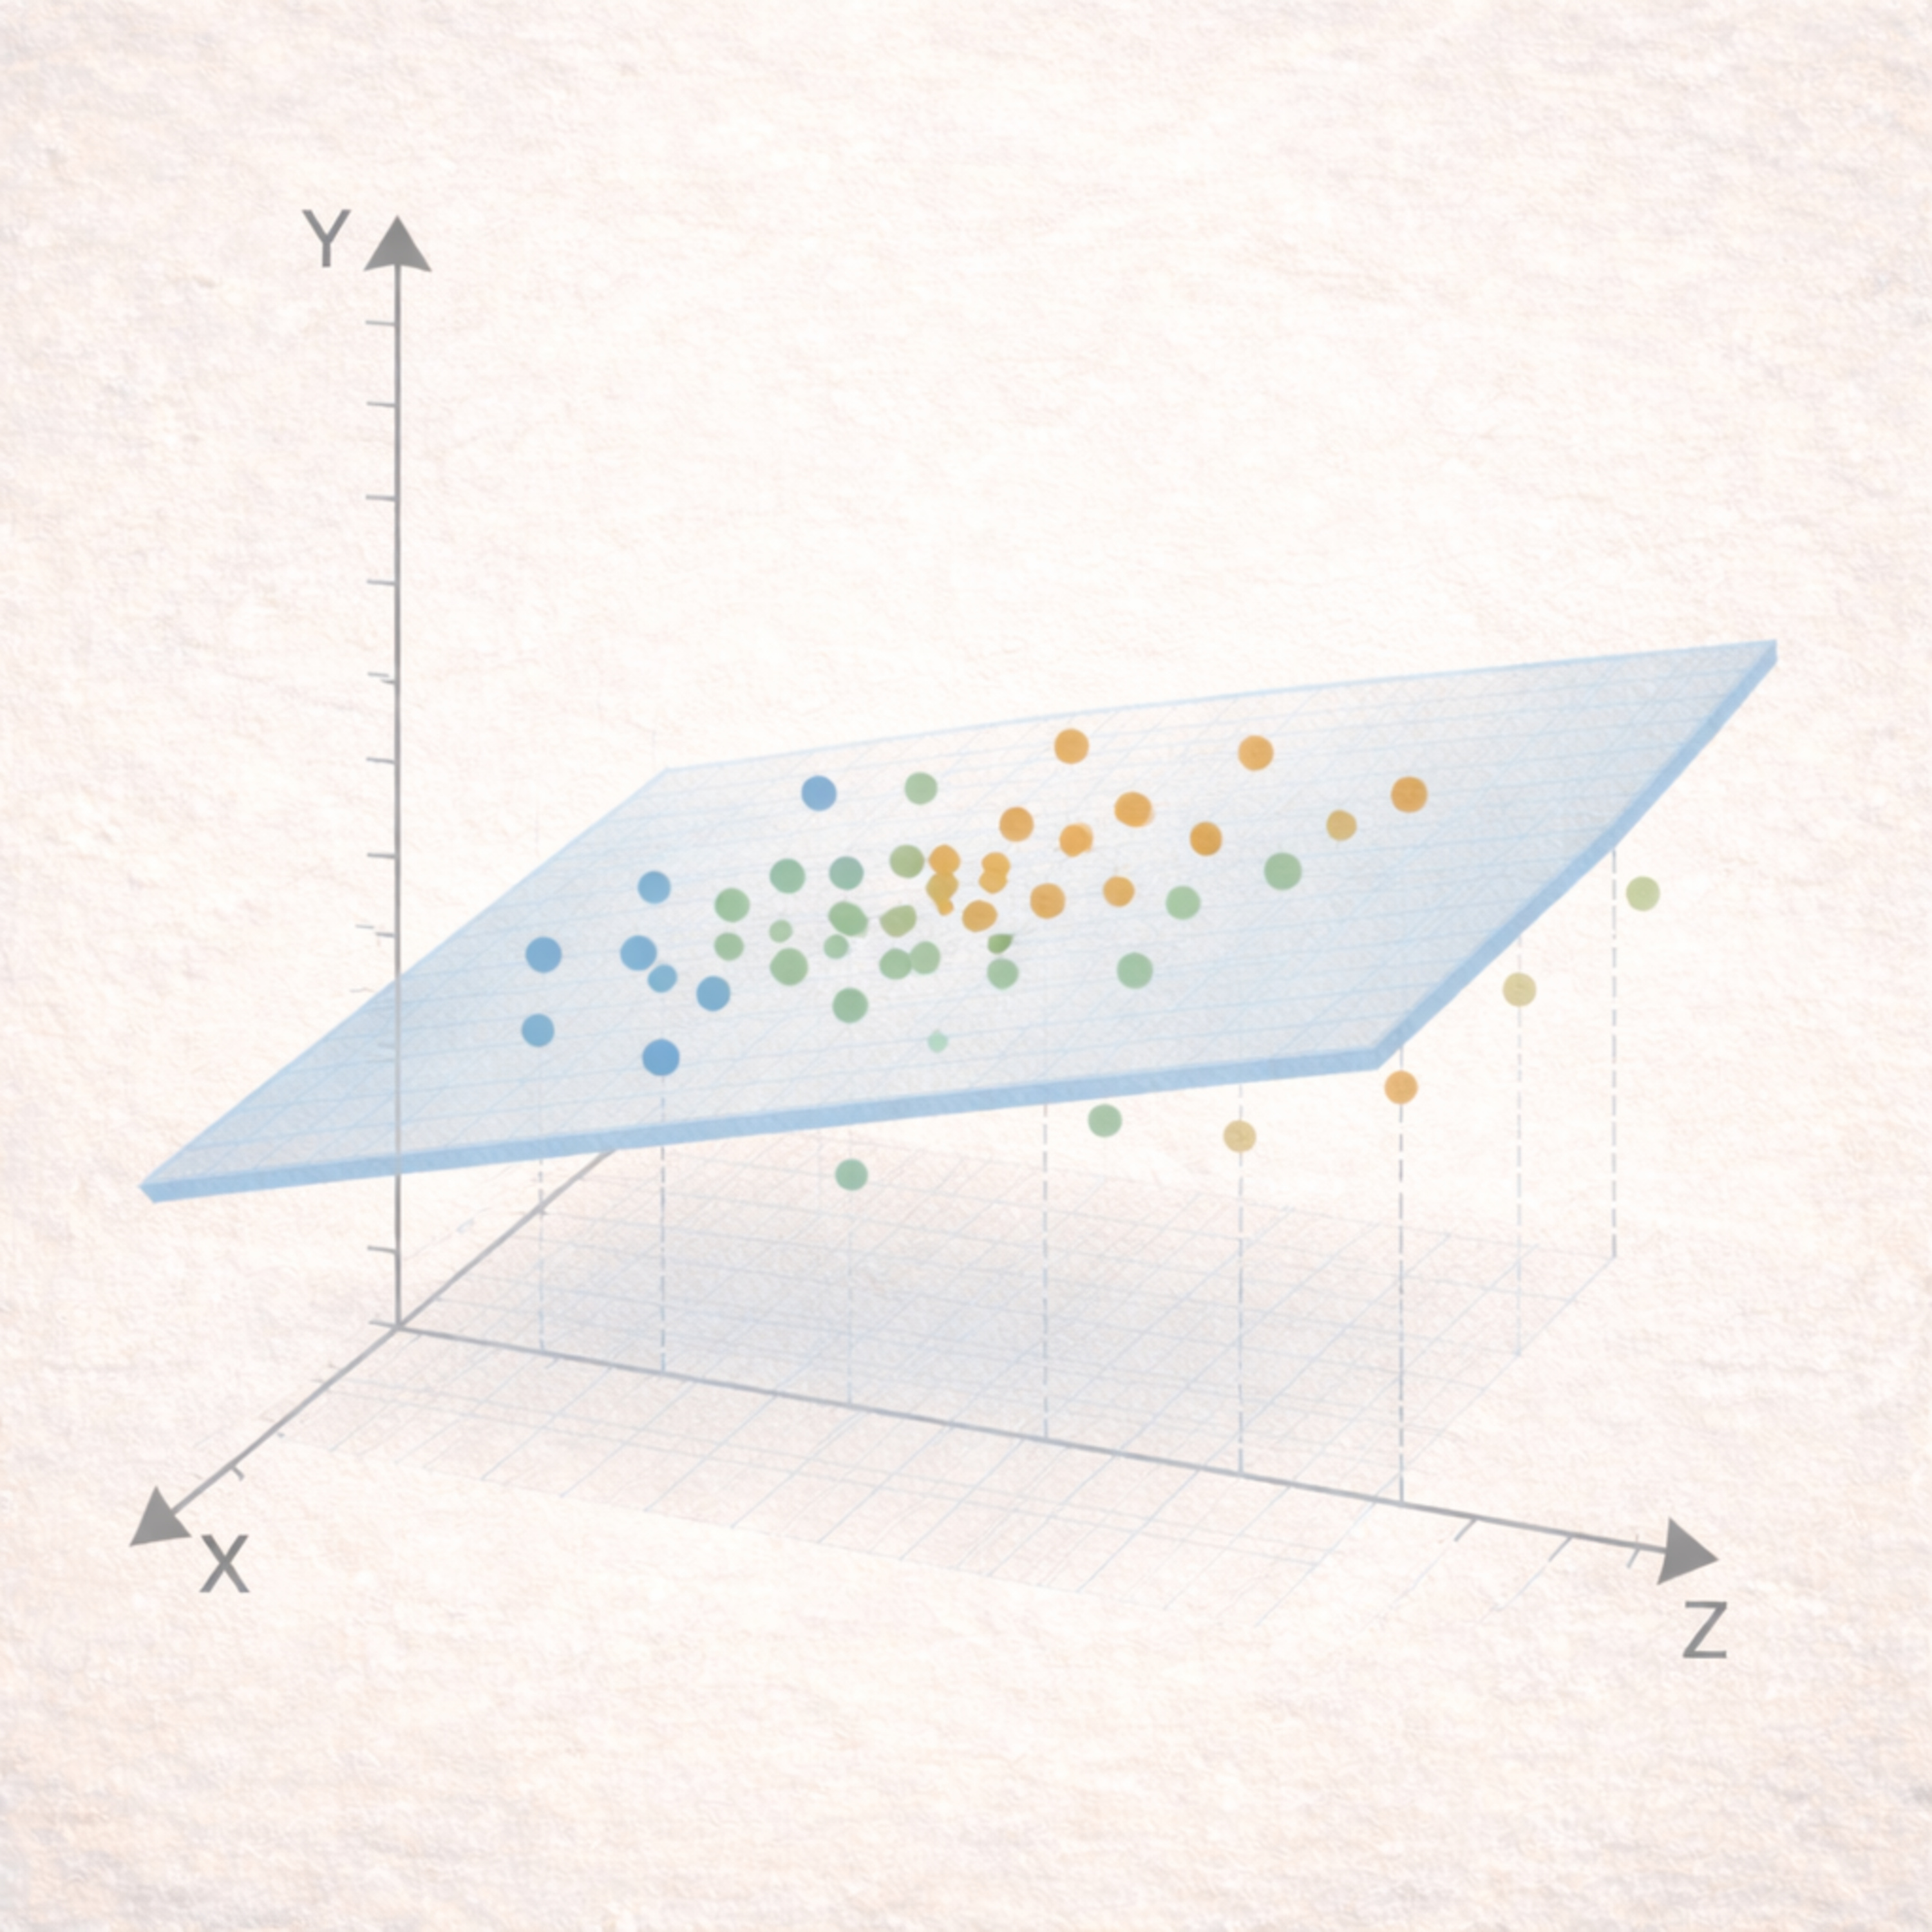
This episode is about what to do when your data has many variables at once. We start with the basic idea of how variables “move together” (correlation and covariance), and why that matters for understanding patterns in real datasets.Then we introduce dimension reduction—ways to compress lots of information into a few summary features, so you can see the main structure without getting lost in detai

Episode 10 | From Chi-Square to GLMs: Beyond Linear Regression
This episode is about working with categorical outcomes—questions where results fall into categories rather than a numeric scale. We learn how to check whether two variables are related, how to model the chance of a “yes/no” outcome using multiple predictors, and how to compare different modeling choices. We finish with simple ways to judge how well a model fits and whether a simpler or more detai

Episode 9 | Categorical Data in Practice: Measures of Association, and Simpson’s Paradox
In this episode, we start with Fisher’s “Lady Tasting Tea”—a classic reminder that good questions need good experimental design. Then we shift from continuous outcomes to categorical data: how a simple 2×2 table turns test results into sensitivity/specificity, and study results into association measures like relative risk and odds ratios.Next, we unpack Simpson’s paradox—how the headline conclusio

Episode 8 | Two-Way ANOVA and Beyond
This episode moves from one-way ANOVA to two-factor randomized experiments, focusing on how to test main effects and, more importantly, interactions—when the effect of one factor depends on the level of the other. Using examples like printer sales and a fish reproduction index, we show how ANOVA partitions variation and supports hypothesis testing. We also give a quick tour of extensions including

Episode 7 | Design of Experiments
This episode introduces the core logic of experimental design and ANOVA: what we mean by causality, factors, and confounders—and why randomization, replication, and blocking are the practical tools that make comparisons fair. We build the one-way ANOVA model, run the hypothesis test in R, and discuss multiple comparisons and how to control Type I error. We also connect ANOVA to regression, highlig

Episode 6 | Model Selection Strategies
Episode 6 is about making multiple regression work in real life: how to choose predictors without overfitting, when to transform variables to fix messy variance or nonlinearity, and what to do when predictors are strongly correlated. We’ll walk through tools like Mallows’ Cp, partial F tests, and stepwise selection, then wrap up with ridge and lasso as practical fixes for multicollinearity—with qu

Episode 5 | Deeper in Multiple Linear Regression
Episode 5 connects the “big picture” of multiple linear regression: the matrix form of the model, how least squares and maximum likelihood lead to the same estimates under standard assumptions, and what the ANOVA table is really decomposing. We compare r-square vs. adjusted r-square, review t-tests for individual predictors and the F-test for overall model validity, and finish with practical model

Episode 4|Multiple Linear Regression
Episode 4 introduces multiple linear regression—how to model an outcome using several predictors at once, and how to interpret each effect while holding the others constant.We cover dummy variables for categorical data, and interaction terms (e.g., how experience and gender together can change salary patterns). We also compare regression with the two-sample mean test, showing how they’re related b

Episode 3|Association, Inference, and Causal Thinking in Simple Linear Regression
This episode builds on simple linear regression by focusing on statistical inference—how we move from a fitted line to meaningful conclusions. We review the intuition behind least squares and explain why switching the roles of the two variables can lead to different fitted lines.We then discuss how to interpret regression results in practice, including point estimates, uncertainty, and the differe
Episode 2|Simple Linear Regression
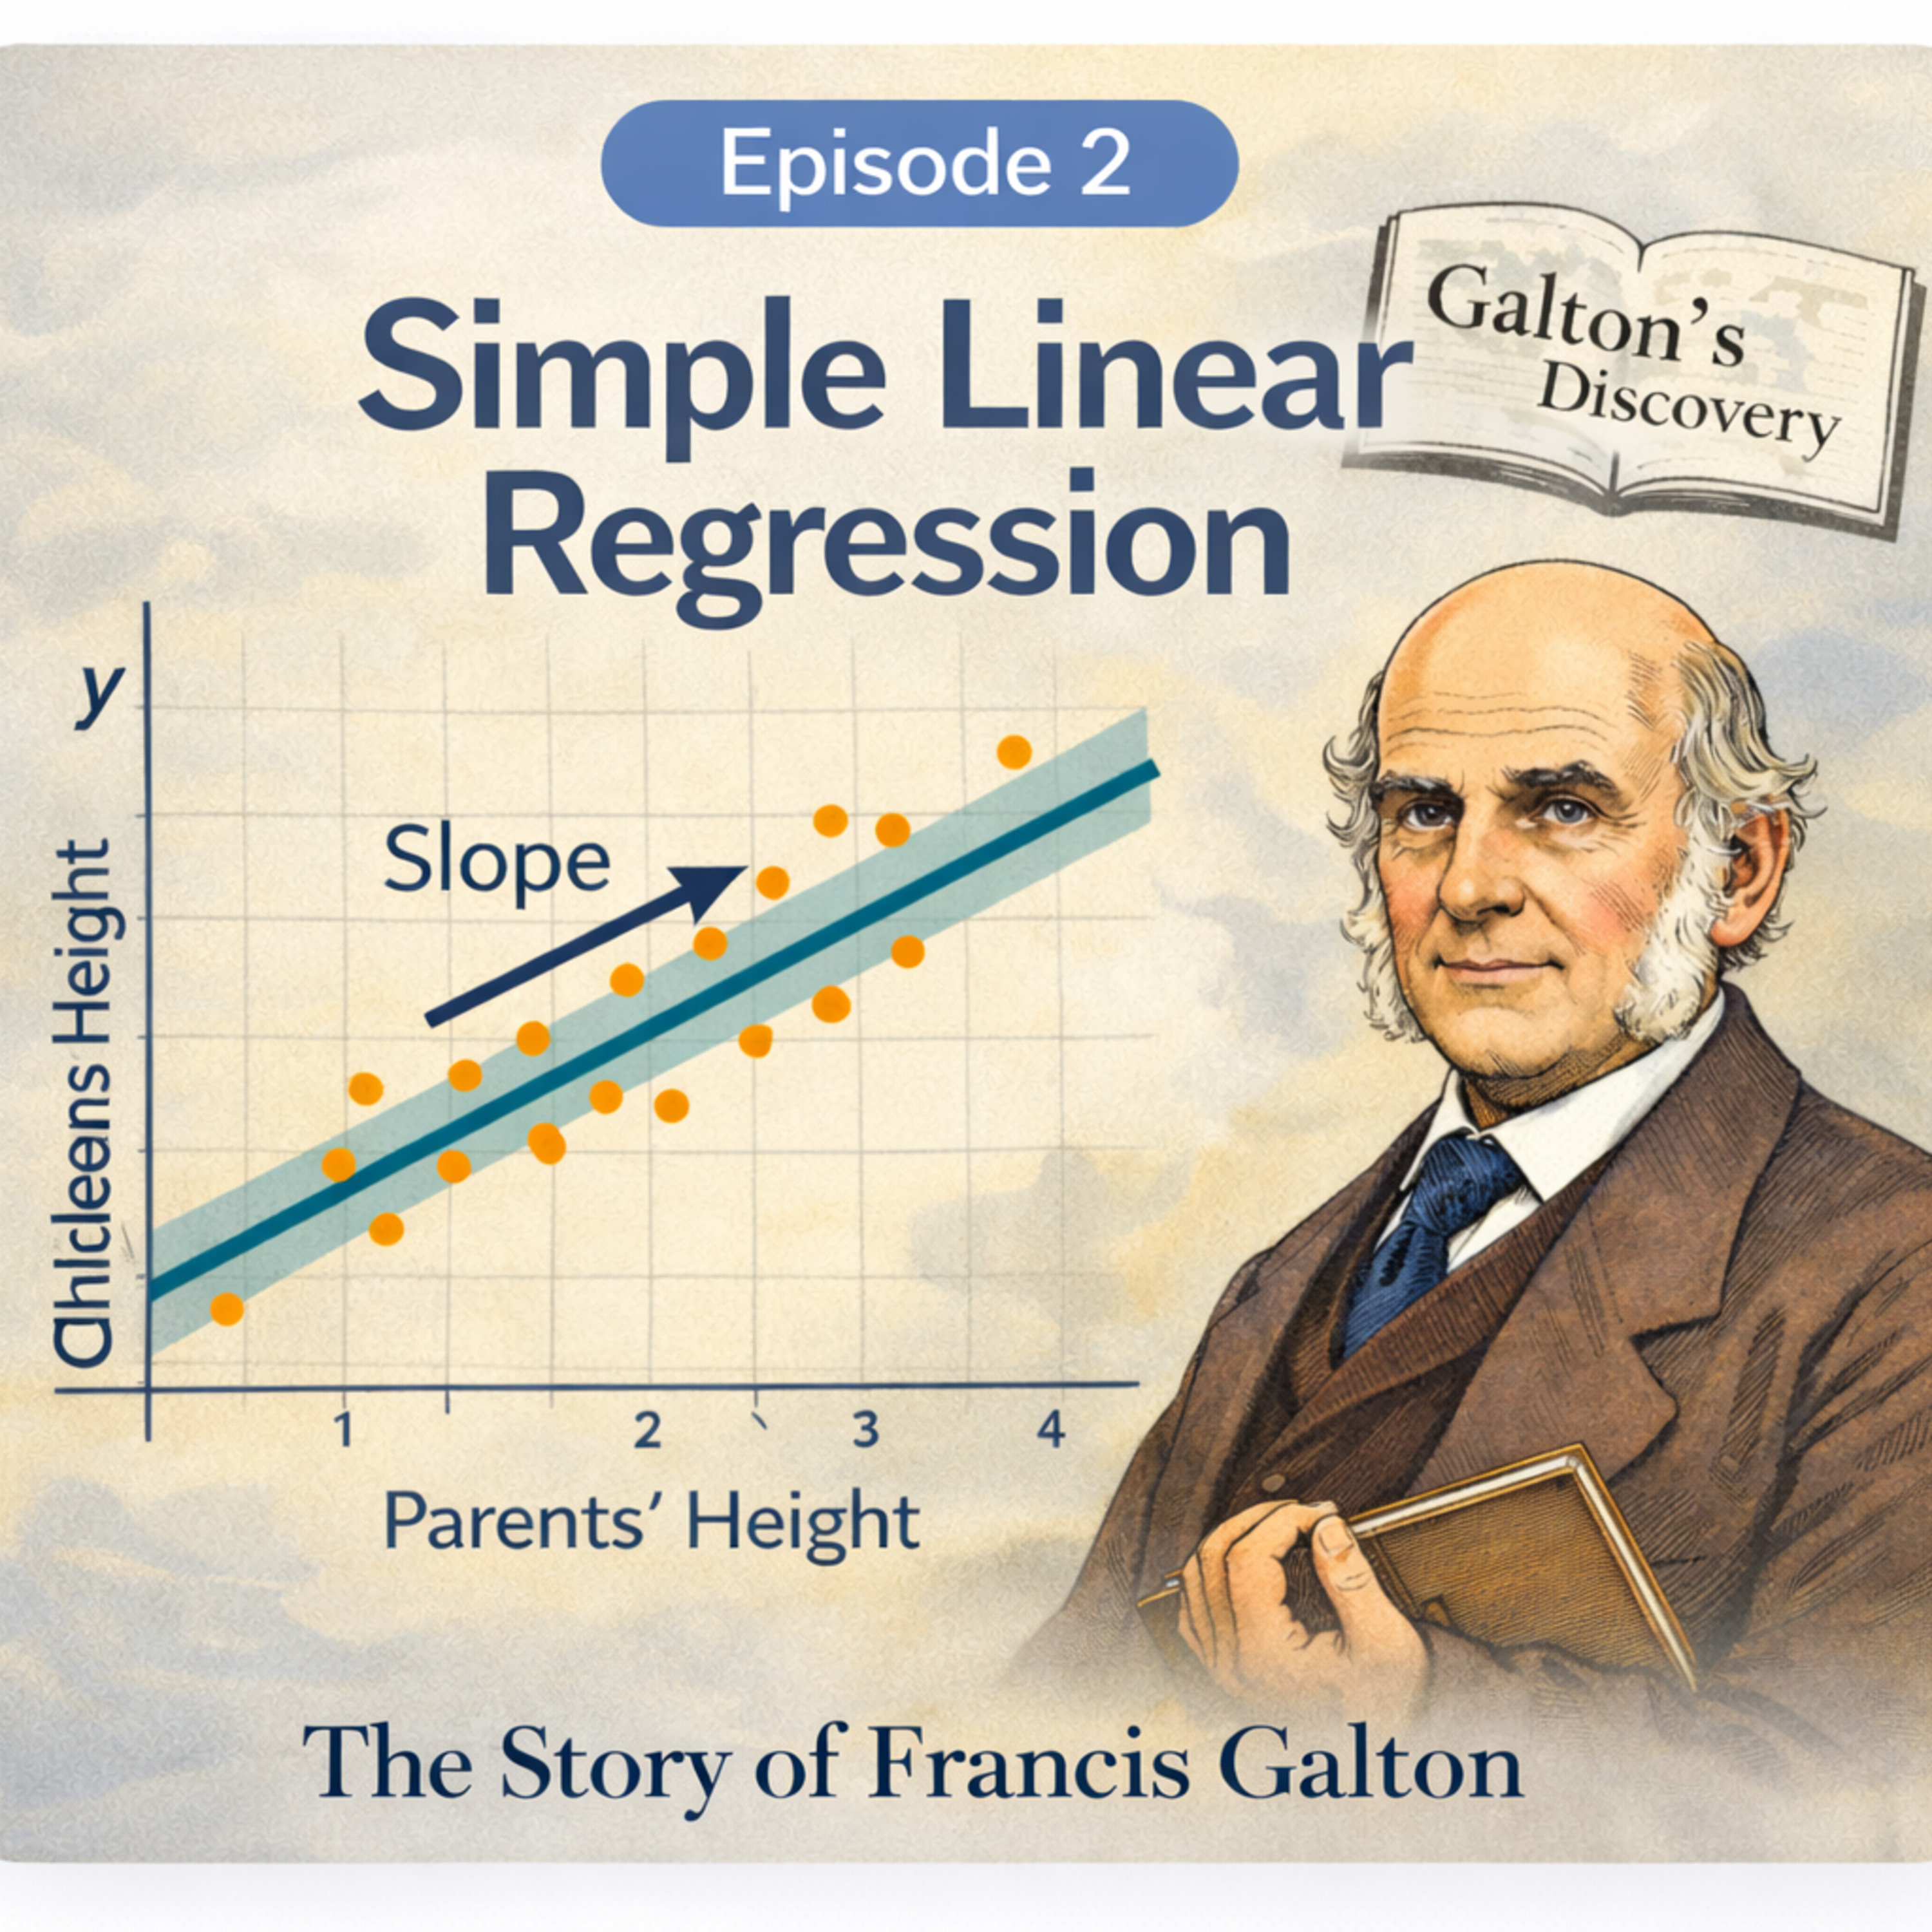
This episode introduces simple linear regression as a tool for understanding trends and making predictions from data. We begin with the historical insight of Francis Galton, whose study of the relationship between parents’ and children’s heights helped popularize the idea of describing association with a straight line.Building on this intuition, we explain the meaning of the slope and intercept in

Episode 1|Seeing Association in Data: Scatter Plots and Correlation
This episode is based on the course syllabus and the first lecture of Applied Statistical Methods. The primary goal is to introduce students to applied data analysis using statistical tools.The lecture focuses on the analysis of association in data, with particular emphasis on graphical methods for describing bivariate relationships. Scatter plots are introduced as a fundamental tool for visualizi